


Major League Baseball stands alone in professional sports with its grueling schedule demands.
The sport requires teams to play 162 regular-season games across roughly six months. This creates unique challenges that affect everything from injury rates to player performance throughout the season. Understanding these impacts helps teams optimize their rosters and manage player workloads effectively.
The density of this schedule creates pressures not seen in other professional sports leagues. Players must maintain peak performance while their bodies accumulate fatigue from daily competition. Research shows measurable declines in various performance metrics as seasons progress.
Keep reading to discover what science reveals about schedule density and MLB performance.
The Unique Demands of MLB’s Marathon Season
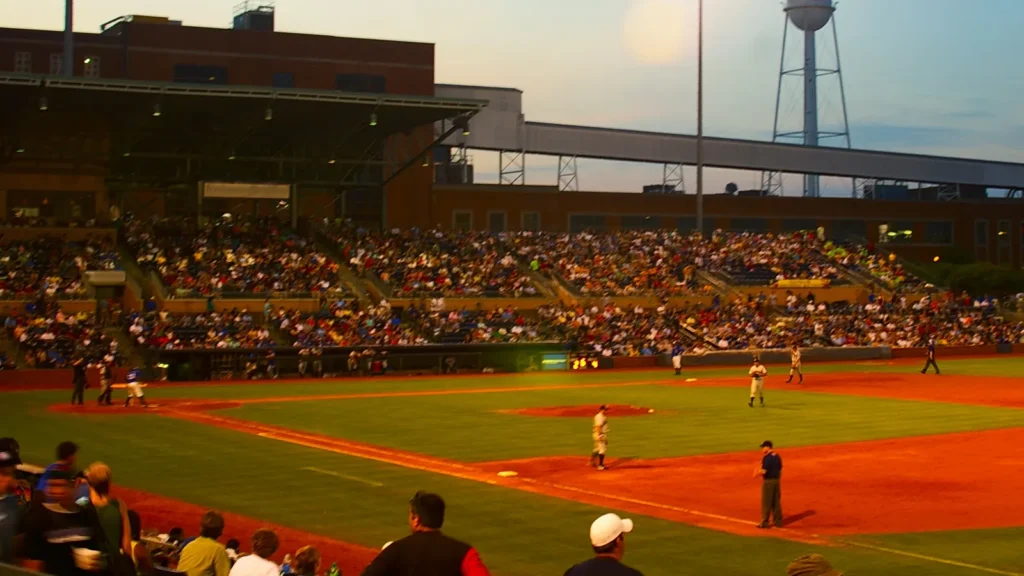
Baseball’s 162-game schedule creates the most demanding regular season in professional sports.
Major League Baseball features 162 games across six months at an average of 6.3 games per week. This schedule has remained unchanged since the American League adopted it in 1961 and the National League followed in 1962. The format allows each team to play all other teams at least once throughout the regular season.
The sheer length creates cumulative physical and mental stress that no other major sport replicates. Playing 162 games means nearly daily competition with minimal rest days scattered throughout. Teams often face stretches of 20 or more consecutive days without a single day off during the season.

How Pitcher Rest Days Affect Injury Rates
Research reveals a clear connection between rest intervals and pitcher health outcomes.
Starting pitchers on MLB teams averaging more than five rest days between starts spent less time on the injured list for musculoskeletal injuries than teams averaging fewer than five rest days from 2022 to 2023. Pitchers with more rest averaged 10.7 days on the injured list per 1,000 pitches compared to 13.6 days for those with less rest. This represents a statistically significant difference in injury burden.
The impact of inadequate rest extends beyond immediate injuries to long-term career health. Teams averaging below five rest days saw their pitchers spend significantly more time sidelined for muscle and joint-related problems. Modern pitch tracking technology allows teams to monitor workload more precisely than ever before.
Cumulative Pitch Counts Impact Performance Metrics
Past pitching workload creates measurable declines in future game performance.
Each pitch thrown in the preceding game increased the earned run average by 0.007 in the following game. Each pitch averaged in the preceding five and 10 games increased the ERA by 0.014 and 0.022, respectively. The cumulative pitching load has a larger impact than a single game performance.
Older pitchers showed more sensitivity to cumulative pitching loads than younger pitchers. However, younger arms were more affected by pitches thrown in the immediately preceding game. Rest days were only weakly associated with performance changes compared to the strong correlation between total pitch counts and effectiveness.
Position Players Face Fatigue Across the Season
Everyday players lose measurable performance when playing consecutive games without rest.
Research indicates fatigue affects player performance, with players losing approximately three points of on-base percentage when playing consecutive games without rest. This decline appears small but becomes meaningful over a full season of at-bats. The effect compounds when players go multiple weeks without a day off from the starting lineup.
Studies tracking workload factors like fewer rest days showed links to increased hamstring and calf strains. Plate appearances and innings played also correlated with soft tissue injury rates. Teams now use color-coded grids to monitor cumulative workload and identify when players enter danger zones for injury.
Strike Zone, Judgment Declines As Seasons Progress
Plate discipline deteriorates measurably from April through September due to accumulated fatigue.
MLB players’ strike zone judgment was worse in September than in April in 24 of 30 teams during the studied seasons. When averaged across all teams, strike zone judgment was significantly worse in September compared with April. The decline followed a linear pattern that could be predicted using data from previous seasons.
The combination of frequent travel and scarcity of off days creates mounting fatigue effects. Teams on both coasts with good or bad records all followed the same pattern of worsening plate discipline. The tendency to swing at pitches outside the strike zone increased progressively throughout the season for nearly every franchise.
Load Management Emerges As Competitive Advantage
Front offices now use tracking technology to create evidence-based rest plans.
Teams track player movements in running 30-day increments using sheets color-coded for high-effort runs and taxing defensive movements. The San Diego Padres monitor top sprint speed while other organizations use proprietary systems for workload measurement. Every movement during games gets logged and analyzed to identify cumulative fatigue patterns.
Players entering danger ranges trigger action plans customized to their specific workload patterns. Some stars prefer playing through fatigue while others embrace strategic rest to maintain peak performance. Managers collaborate with medical teams and players to lighten pregame and postgame workloads without necessarily sitting them from lineups.
Travel Schedules Compound Physical Demands
Geographic logistics add another layer of stress to already packed game calendars.
The 162-game schedule gets played in 183 days, with many of those 21 off days consumed by cross-country travel. Teams regularly face red eye flights after night games, followed by afternoon starts the next day. West Coast to East Coast swings create jet lag effects that research links to decreased performance.
Players must maintain routines while constantly changing time zones and sleeping in different cities. The mental toll of this schedule adds to physical fatigue from actual gameplay. Some players report difficulty getting quality sleep during road trips which research shows impacts career longevity.

TL;DR
- MLB’s 162-game schedule over six months creates unique fatigue and injury challenges.
- Pitchers with more than five rest days between starts spend significantly less time injured.
- Cumulative pitch counts impact ERA more than single-game workloads.
- Position players lose approximately three points of OBP playing consecutive games without rest.
- Strike zone judgment declines linearly from April to September across nearly all teams.
Read More:
- MLB’s Greatest Moments Fans Never Forget
- The Importance of Clubhouse Leaders in MLB Success
- MLB’s iconic home runs that became legendary
This article was made with AI assistance and human editing.


