FIFA World Cup 2026 used 11 U.S. stadiums
The FIFA World Cup 2026 used 11 stadiums in the United States, which staged 78 of the tournament’s 104 matches. Canada and Mexico hosted 13 games each across the remaining five venues.
The tournament drew 6,810,966 spectators, averaging 65,490 per match with 99.7% venue occupancy. This ranking prioritizes knockout importance first, followed by match count, attendance, and confirmed tournament milestones at each American stadium.
New York New Jersey Stadium ranks first
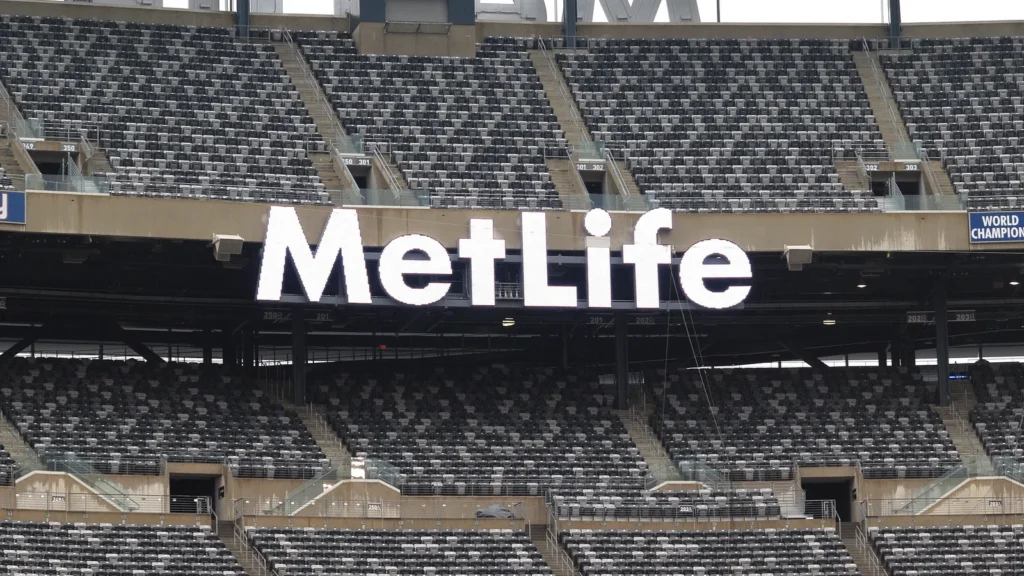
New York-New Jersey Stadium ranks first after hosting eight matches, including the World Cup final. Every game drew more than 80,000 spectators, while its official tournament capacity of 80,663 was the highest among U.S. venues.
Spain defeated Argentina 1-0 after extra time on July 19, with Ferran Torres scoring in the 106th minute. The stadium also welcomed several former World Cup champions throughout its tournament schedule.

Dallas Stadium ranks second
Dallas Stadium ranks second after staging 9 matches, more than any other 2026 World Cup venue. Its schedule included 5 group-stage games, 2 round-of-32 matches, 1 round-of-16 match and a semifinal.
Spain defeated France 2-0 in that semifinal, closing Dallas Stadium’s tournament run. Earlier, the venue welcomed the 50 millionth spectator in World Cup history during Spain’s round-of-16 victory over Portugal.
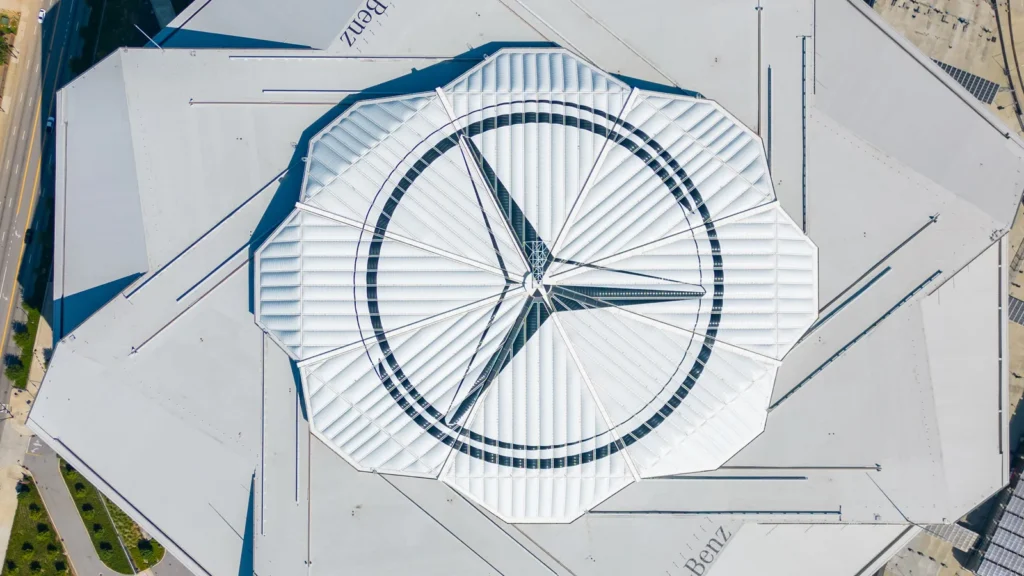
Atlanta Stadium ranks third
Atlanta Stadium ranks third because its eight-match schedule ended with a World Cup semifinal. More than 500,000 spectators attended games there, while both eventual finalists appeared twice at the Georgia venue during the tournament.
Argentina defeated England 2-1 on July 15 to reach the final, while Spain had already played twice in Atlanta. The stadium also hosted teams making their first World Cup appearances during the 2026 competition.
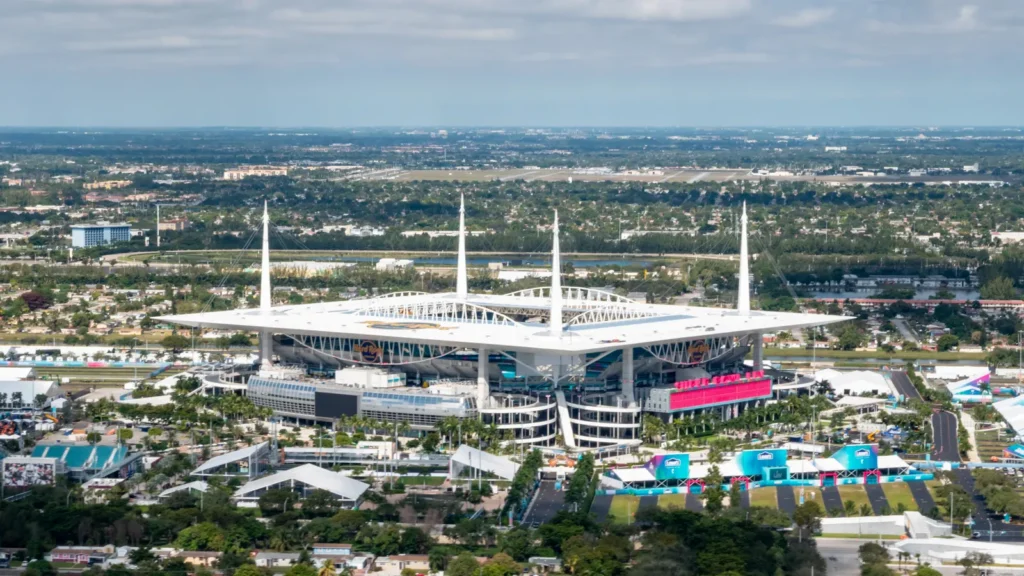
Miami Stadium ranks fourth
Miami Stadium ranks fourth after hosting seven matches, including a quarterfinal and the third-place game. Combined attendance reached 449,157, filling 99.5% of available tournament capacity across the venue’s complete schedule in Miami Gardens.
England defeated France 6-4 in Miami’s final match, producing 10 goals in the third-place contest. Across all seven games, the venue averaged 3.86 goals per match during the World Cup.
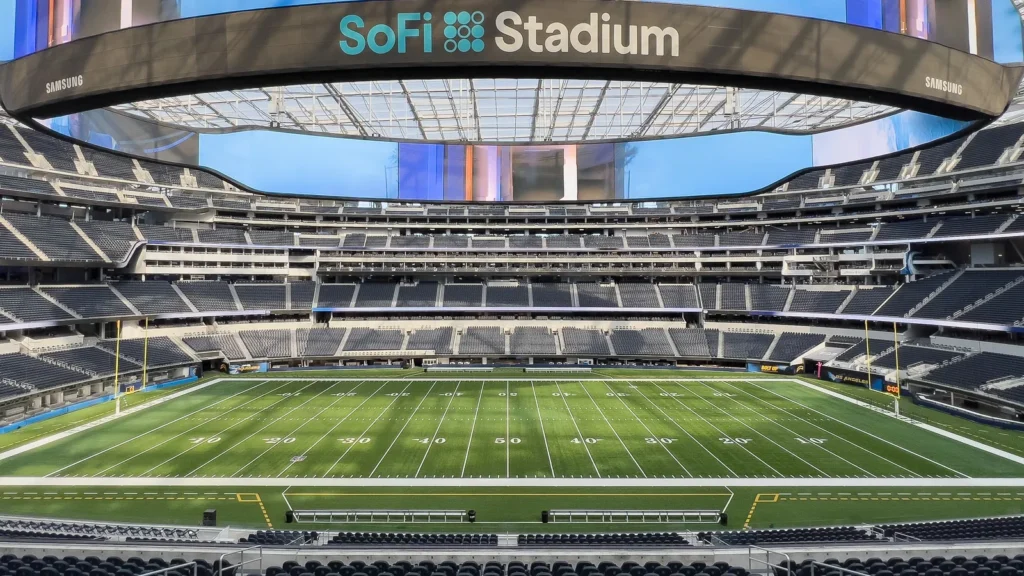
Los Angeles Stadium ranks fifth
Los Angeles Stadium ranks fifth after hosting eight matches and welcoming 561,656 spectators at 99.6% capacity. The Inglewood venue staged five group games, two round-of-32 contests, and one quarterfinal during the tournament.
The United States opened its campaign with a 4-1 victory over Paraguay. Los Angeles closed with Spain defeating Belgium after Mikel Merino scored the deciding goal in the 88th minute of the quarterfinal.
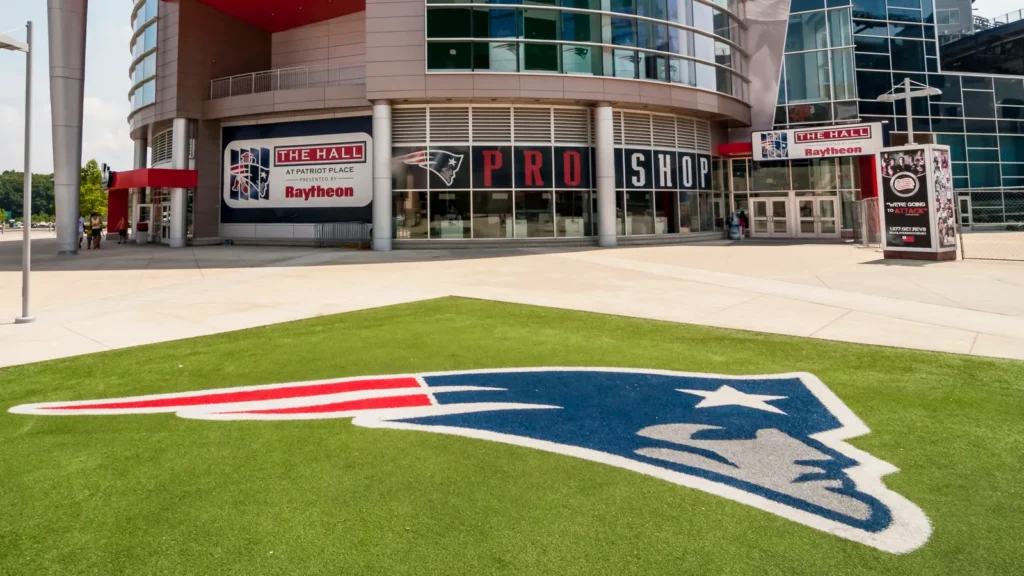
Boston Stadium ranks sixth
Boston Stadium ranks sixth after hosting seven matches, including a quarterfinal, while filling 99.6% of available capacity. Nearly 450,000 spectators attended games at the Foxborough venue during the 2026 tournament.
France ended Boston’s schedule with a 2-0 quarterfinal victory over Morocco on July 9. The venue’s highlights also included strong Scottish support and an Ousmane Dembélé hat-trick completed within 32 minutes.
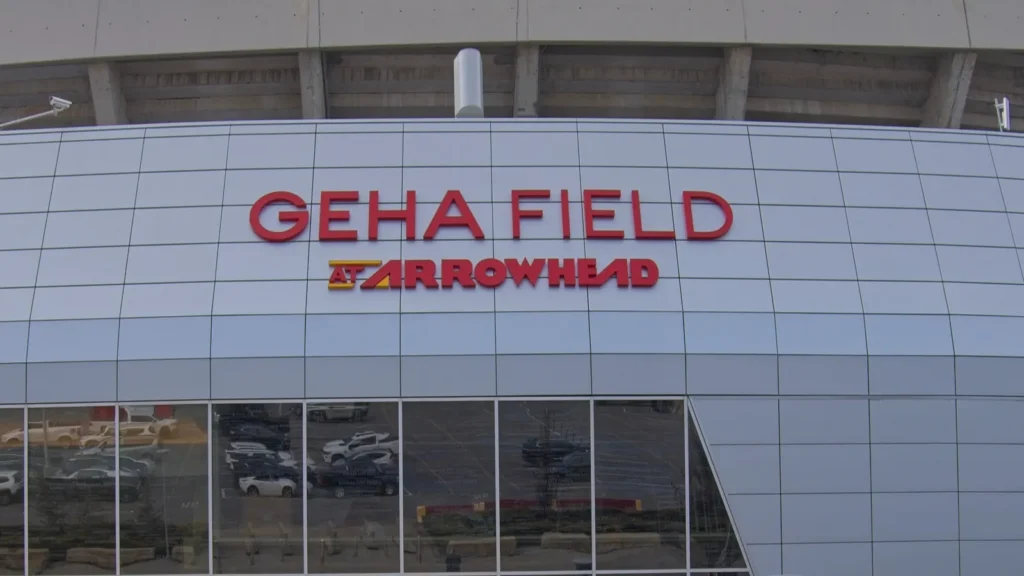
Kansas City Stadium ranks seventh
Kansas City Stadium ranks seventh after hosting 6 matches and drawing 413,169 spectators, an average of 68,862 per game. The venue operated at 99.7% capacity and carried its schedule from group play through an Argentina quarterfinal.
Lionel Messi produced Kansas City’s defining performance by scoring 3 goals against Algeria in his 200th international appearance. The display made him the oldest player to record a World Cup hat trick.

Houston Stadium ranks eighth
Houston Stadium ranks eighth after hosting seven matches, including two knockout games. Its group-stage schedule produced the joint-highest goal total among tournament venues, matching Vancouver before elimination play began.
Morocco closed Houston’s World Cup program by defeating Canada 3-0 in the round of 16 on July 4. The result sent Morocco into the quarterfinals and ended the co-host’s tournament campaign in Texas.
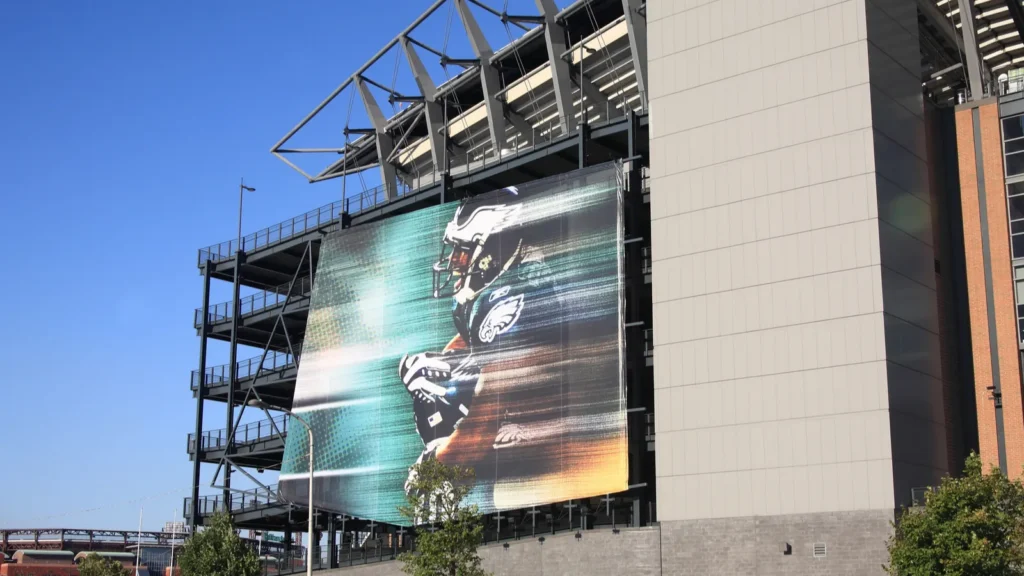
Philadelphia Stadium ranks ninth
Philadelphia Stadium ranks ninth after six matches, averaging 68,316 spectators per match. The Pennsylvania venue hosted five group contests and one round-of-16 game, bringing teams from five FIFA confederations to the city.
Kylian Mbappé marked his 100th international appearance during Philadelphia’s final World Cup match against Paraguay. Tournament operations also redirected 20,000 pounds of surplus food from matchdays into local community distribution.
Fun fact: Dallas Stadium’s giant center-hung video display covers about 25,000 square feet, meaning fans could watch soccer above the field on a screen larger than many houses.
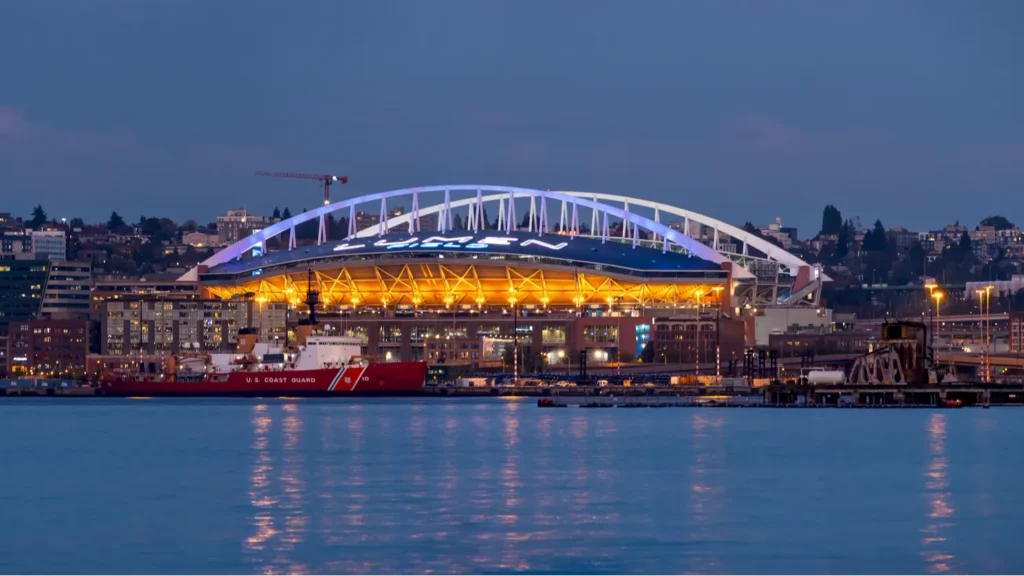
Seattle Stadium ranks 10th
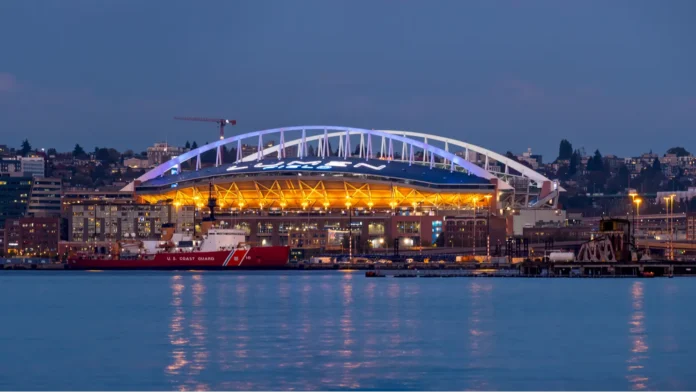
Seattle Stadium ranks 10th after hosting 6 matches, attracting 401,500 spectators and reaching 100% occupancy. The venue hosted group-stage games featuring the United States before staging one of the tournament’s round-of-16 contests.
Belgium ended Seattle’s World Cup schedule with a 4-1 victory over the United States on July 6. The result sent Belgium into the quarterfinals and concluded the host nation’s tournament run.
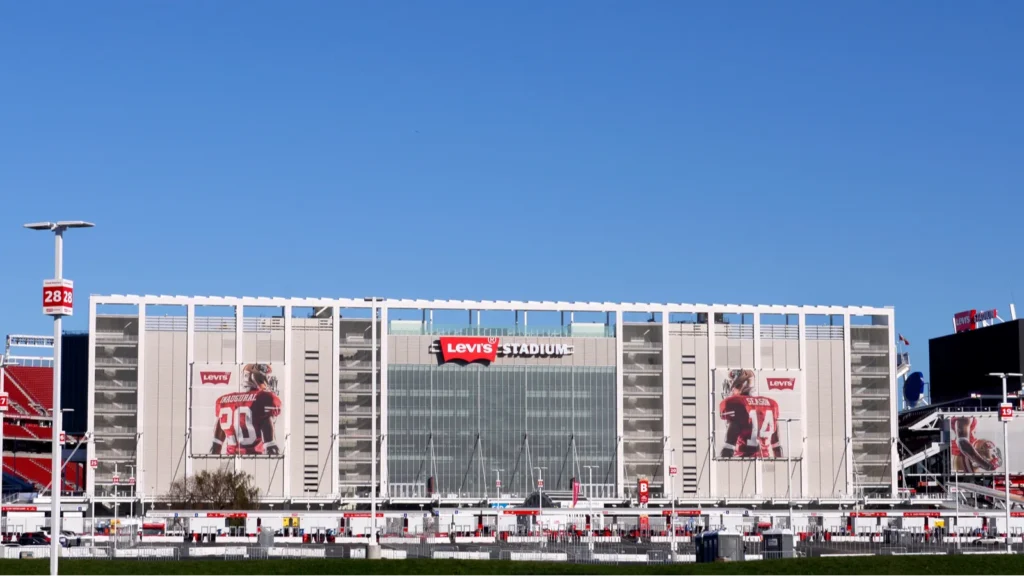
San Francisco Bay Area ranks 11th
San Francisco Bay Area Stadium ranks 11th after hosting 6 matches, averaging 68,558 spectators per game and filling 99.6% of available capacity. A total of 10 teams from 5 confederations played at the Santa Clara venue during the tournament.
The United States closed the stadium’s program by defeating Bosnia and Herzegovina 2-0 in the Round of 32. The July 1 victory sent the Americans into a round-of-16 matchup in Seattle.
Lionel Messi built a career few soccer legends can match, with milestones that still separate him from other greats.
U.S. stadium scale shaped the ranking
The top three U.S. venues in this ranking hosted 25 matches combined, including both semifinals and the final. New York New Jersey, Dallas, and Atlanta therefore staged nearly one-third of America’s 78 games.
U.S. tournament capacities ranged from 64,146 at Boston Stadium to 80,663 at New York New Jersey Stadium. Eight of the 11 American venues had official FIFA capacities ranging from 66,925 to 70,649 spectators.
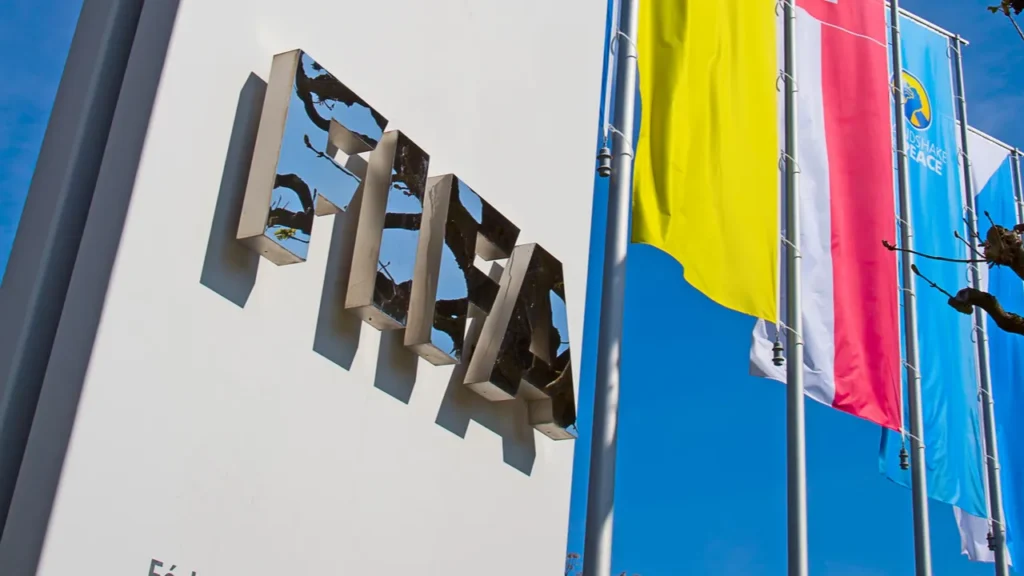
A Times Square billboard has put fresh focus on criticism surrounding FIFA leadership and the organization’s public image. “FIFA deserves a leader, not a dealer,” Times Square billboard declares, raising questions about what prompted the message.
Which U.S. World Cup stadium impressed you most for atmosphere, scale, or memorable matches, and which venue would you rank higher or lower? Share your thoughts in the comments below!
This slideshow was made with AI assistance and human editing.
Read More From This Brand: